
Harnessing Data for Sustainable Mobility: Race Day in Zandvoort
We partnered with the Mobility Team to develop a real-time data platform that tracks and analyzes how attendees travel to Circuit Zandvoort, with a focus on sustainability. Using a combination of AI-powered sensors, APIs from transportation providers and manual data collection, we gathered key insights on travel patterns.



Executive Summary
We partnered with the Mobility Team to develop a real-time data platform that tracks and analyzes how attendees travel to Circuit Zandvoort, with a focus on sustainability. Using a combination of AI-powered sensors, APIs from transportation providers and manual data collection, we gathered key insights on travel patterns.
The platform allowed decision-makers to monitor sustainability efforts and optimize transport operations. Built with robust technologies like Django and Nuxt.js, the platform processed over 40,000 data points, helping to achieve 99% sustainable travel for more than 110,000 attendees daily.
Product Type: Web App
Deliverables: Development strategy, data analysis, API development, front-end engineering, back-end engineering, database engineering.
- Data Points
- 40,000+
- Downtime
- 0%
- Attendees Daily
- 110,000+
- Sustainable Travel
- 99%
The Client
The Mobility Dashboard is a joint venture of HIRS advies and Crafture.
HIRS advies
HIRS advies specializes in traffic management for roadworks and events. Founded by Roy Hirs, the company has extensive experience working on both the contractor and client sides of projects. With a strong focus on determination, creating optimal customer journeys and an open-minded approach, HIRS advies views every problem as a challenge to be solved, ensuring effective traffic measures during construction and event operations.
Crafture
Crafture is a digital agency founded in 2009, focused on creating innovative digital campaigns for global brands in the Benelux market. With a passion for music and movies from the past, Crafture combines nostalgia with modern technology to deliver cutting-edge campaigns. The agency specializes in storytelling, using data-driven strategies and new technologies such as video, virtual reality and augmented reality to engage the right audience.
Introduction
The Netherlands has been part of the Formula One World Championship from 1952 through 1985, and after a 35 year hiatus, from 2021 onwards.
We have collaborated with the Mobility Team for three consecutive years to track and analyze attendees' travel to Zandvoort Circuit.
The Challenge
One of the goals of the organizers is to have the attendees travel sustainably. This aligns with the overall goal of F1’s sustainability strategy of reaching Net Zero Carbon by 2030.
During the entire period of the event, the city of Zandvoort is only accessible to permit holders and residents.
Attendees must walk, use bicycles, public transport, buses, or other sustainable means to reach the event.
Our involvement started in 2022 when the mobility team tasked us to develop a platform that accurately tracks and analyzes how attendees travel to the race track.
The team's vision for the platform was to assist with decision making and also measure sustainability.
Our task was to connect, gather, measure, analyze and display the data in real-time.
The Solution
We developed a comprehensive real-time data platform that gathers and processes transportation data using AI-powered camera sensors, APIs from transportation providers, and manual data collection. The platform enabled precise tracking of how attendees traveled to the Zandvoort Circuit..
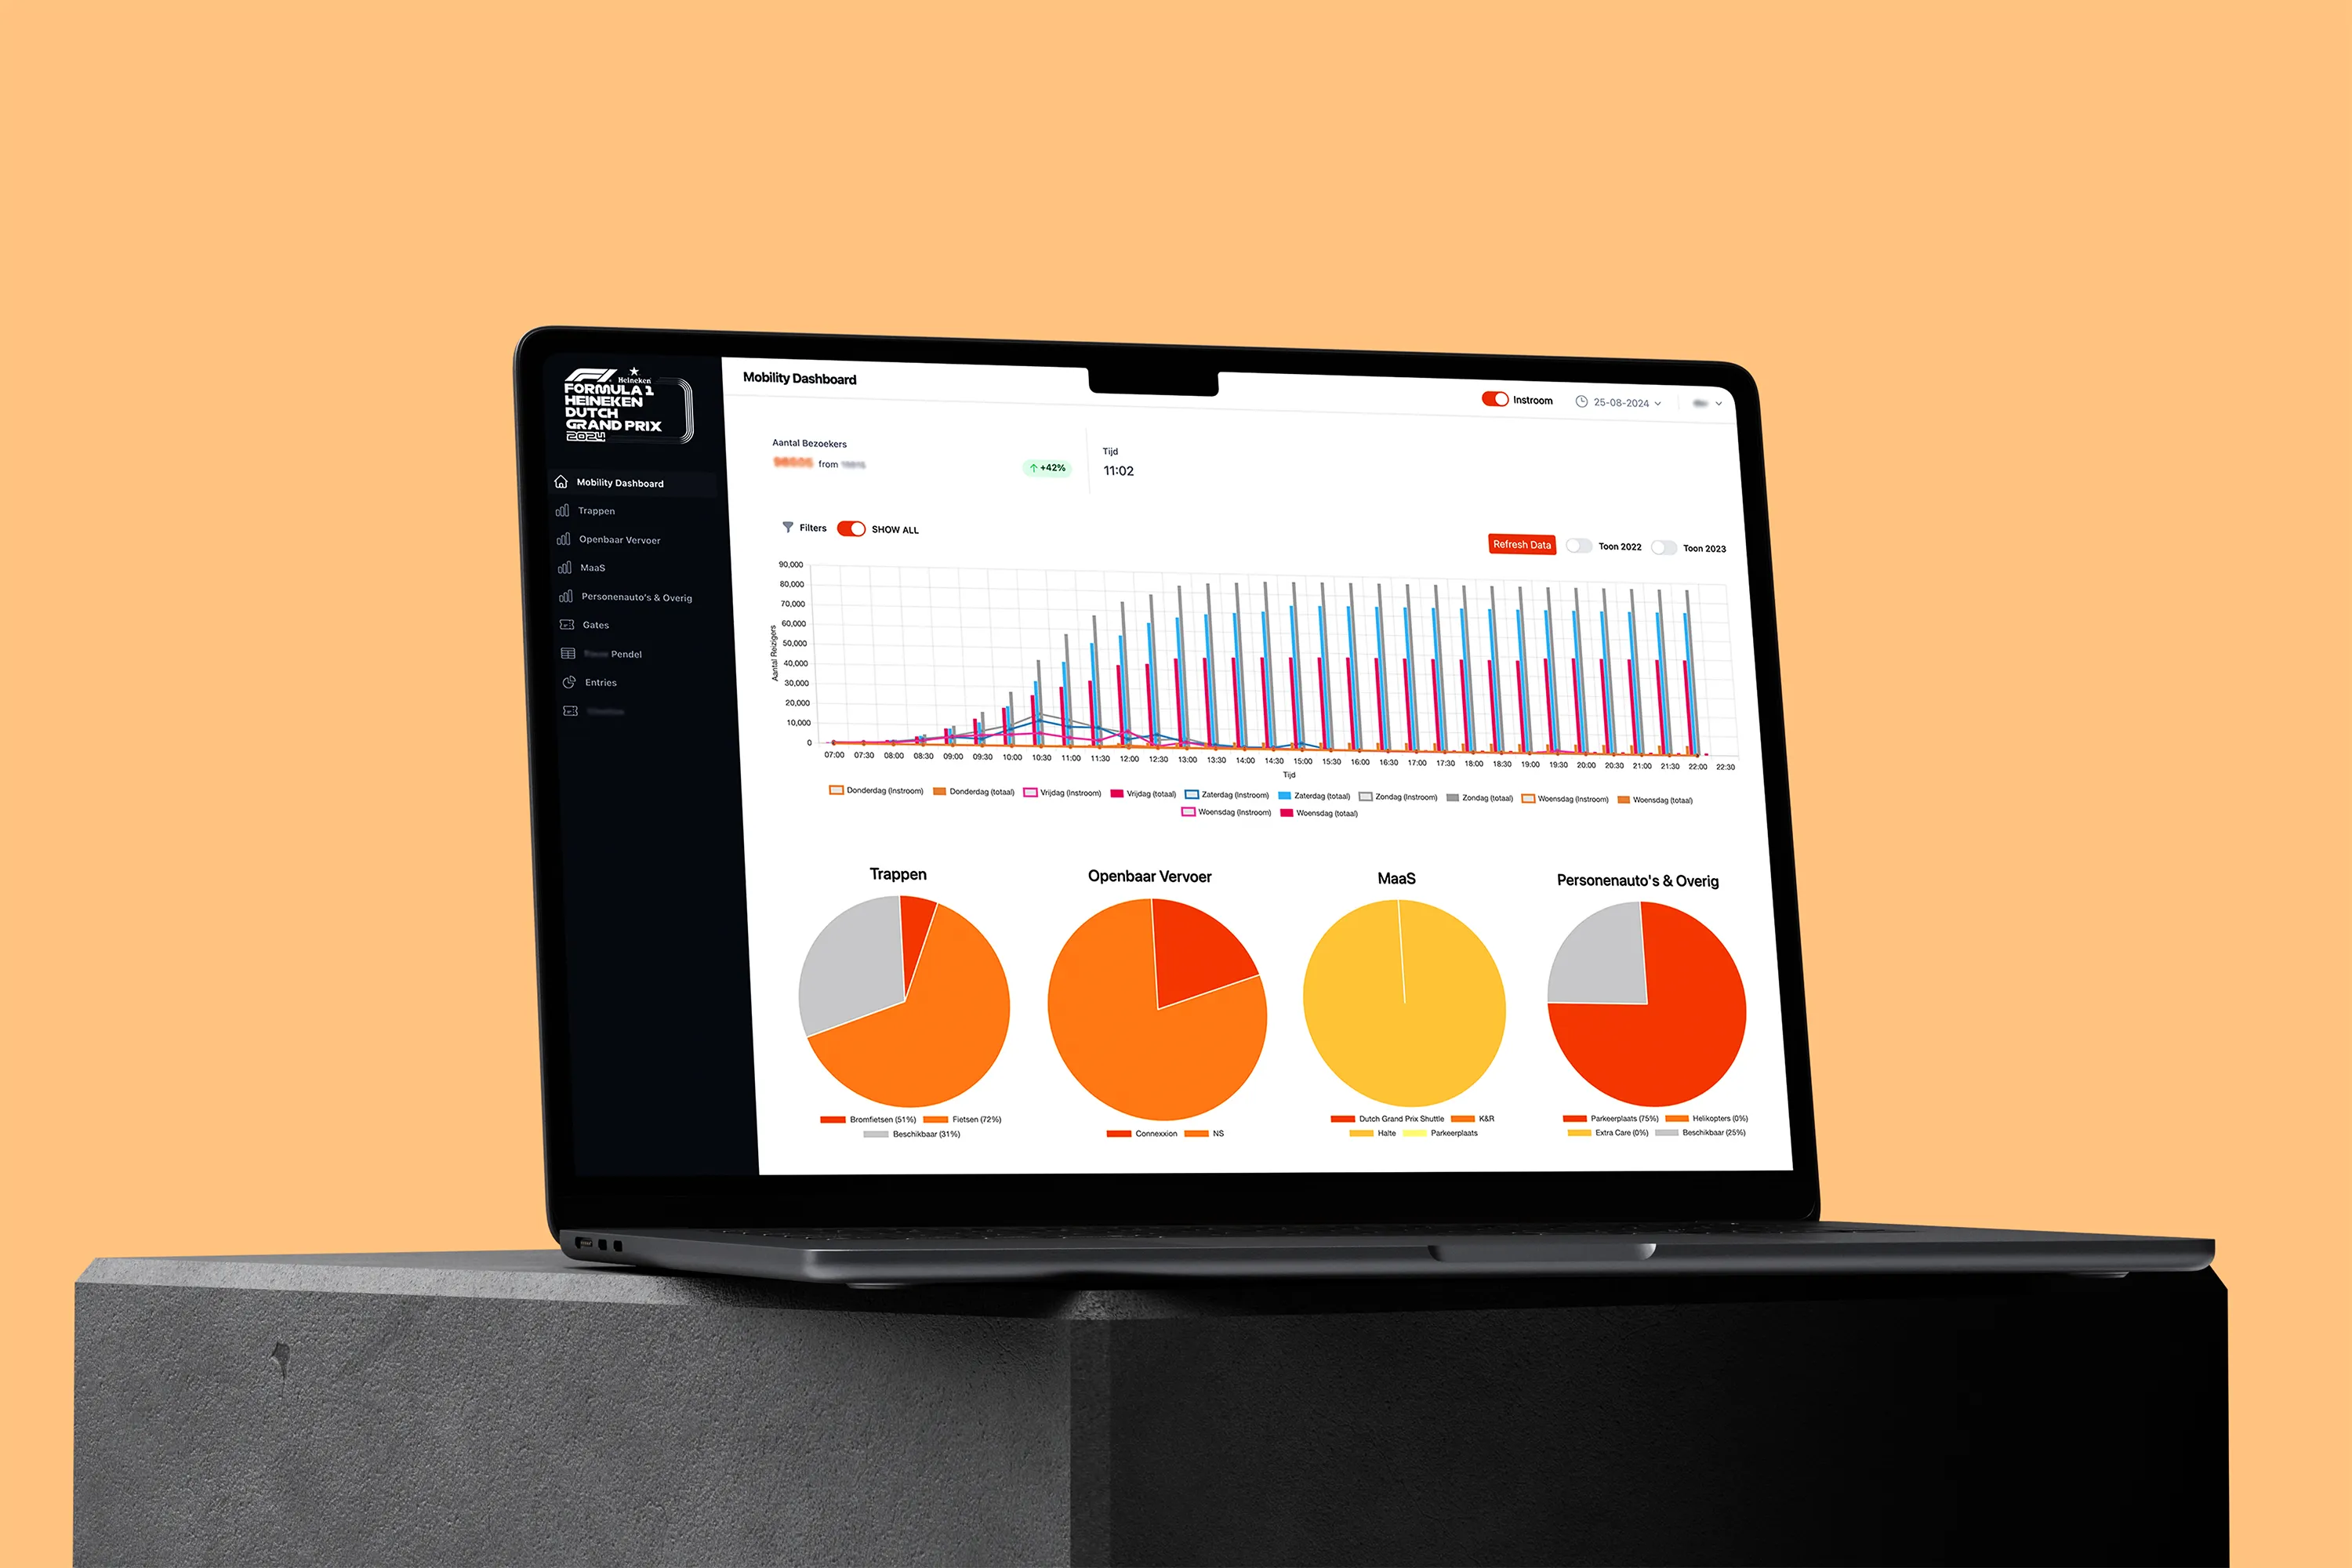
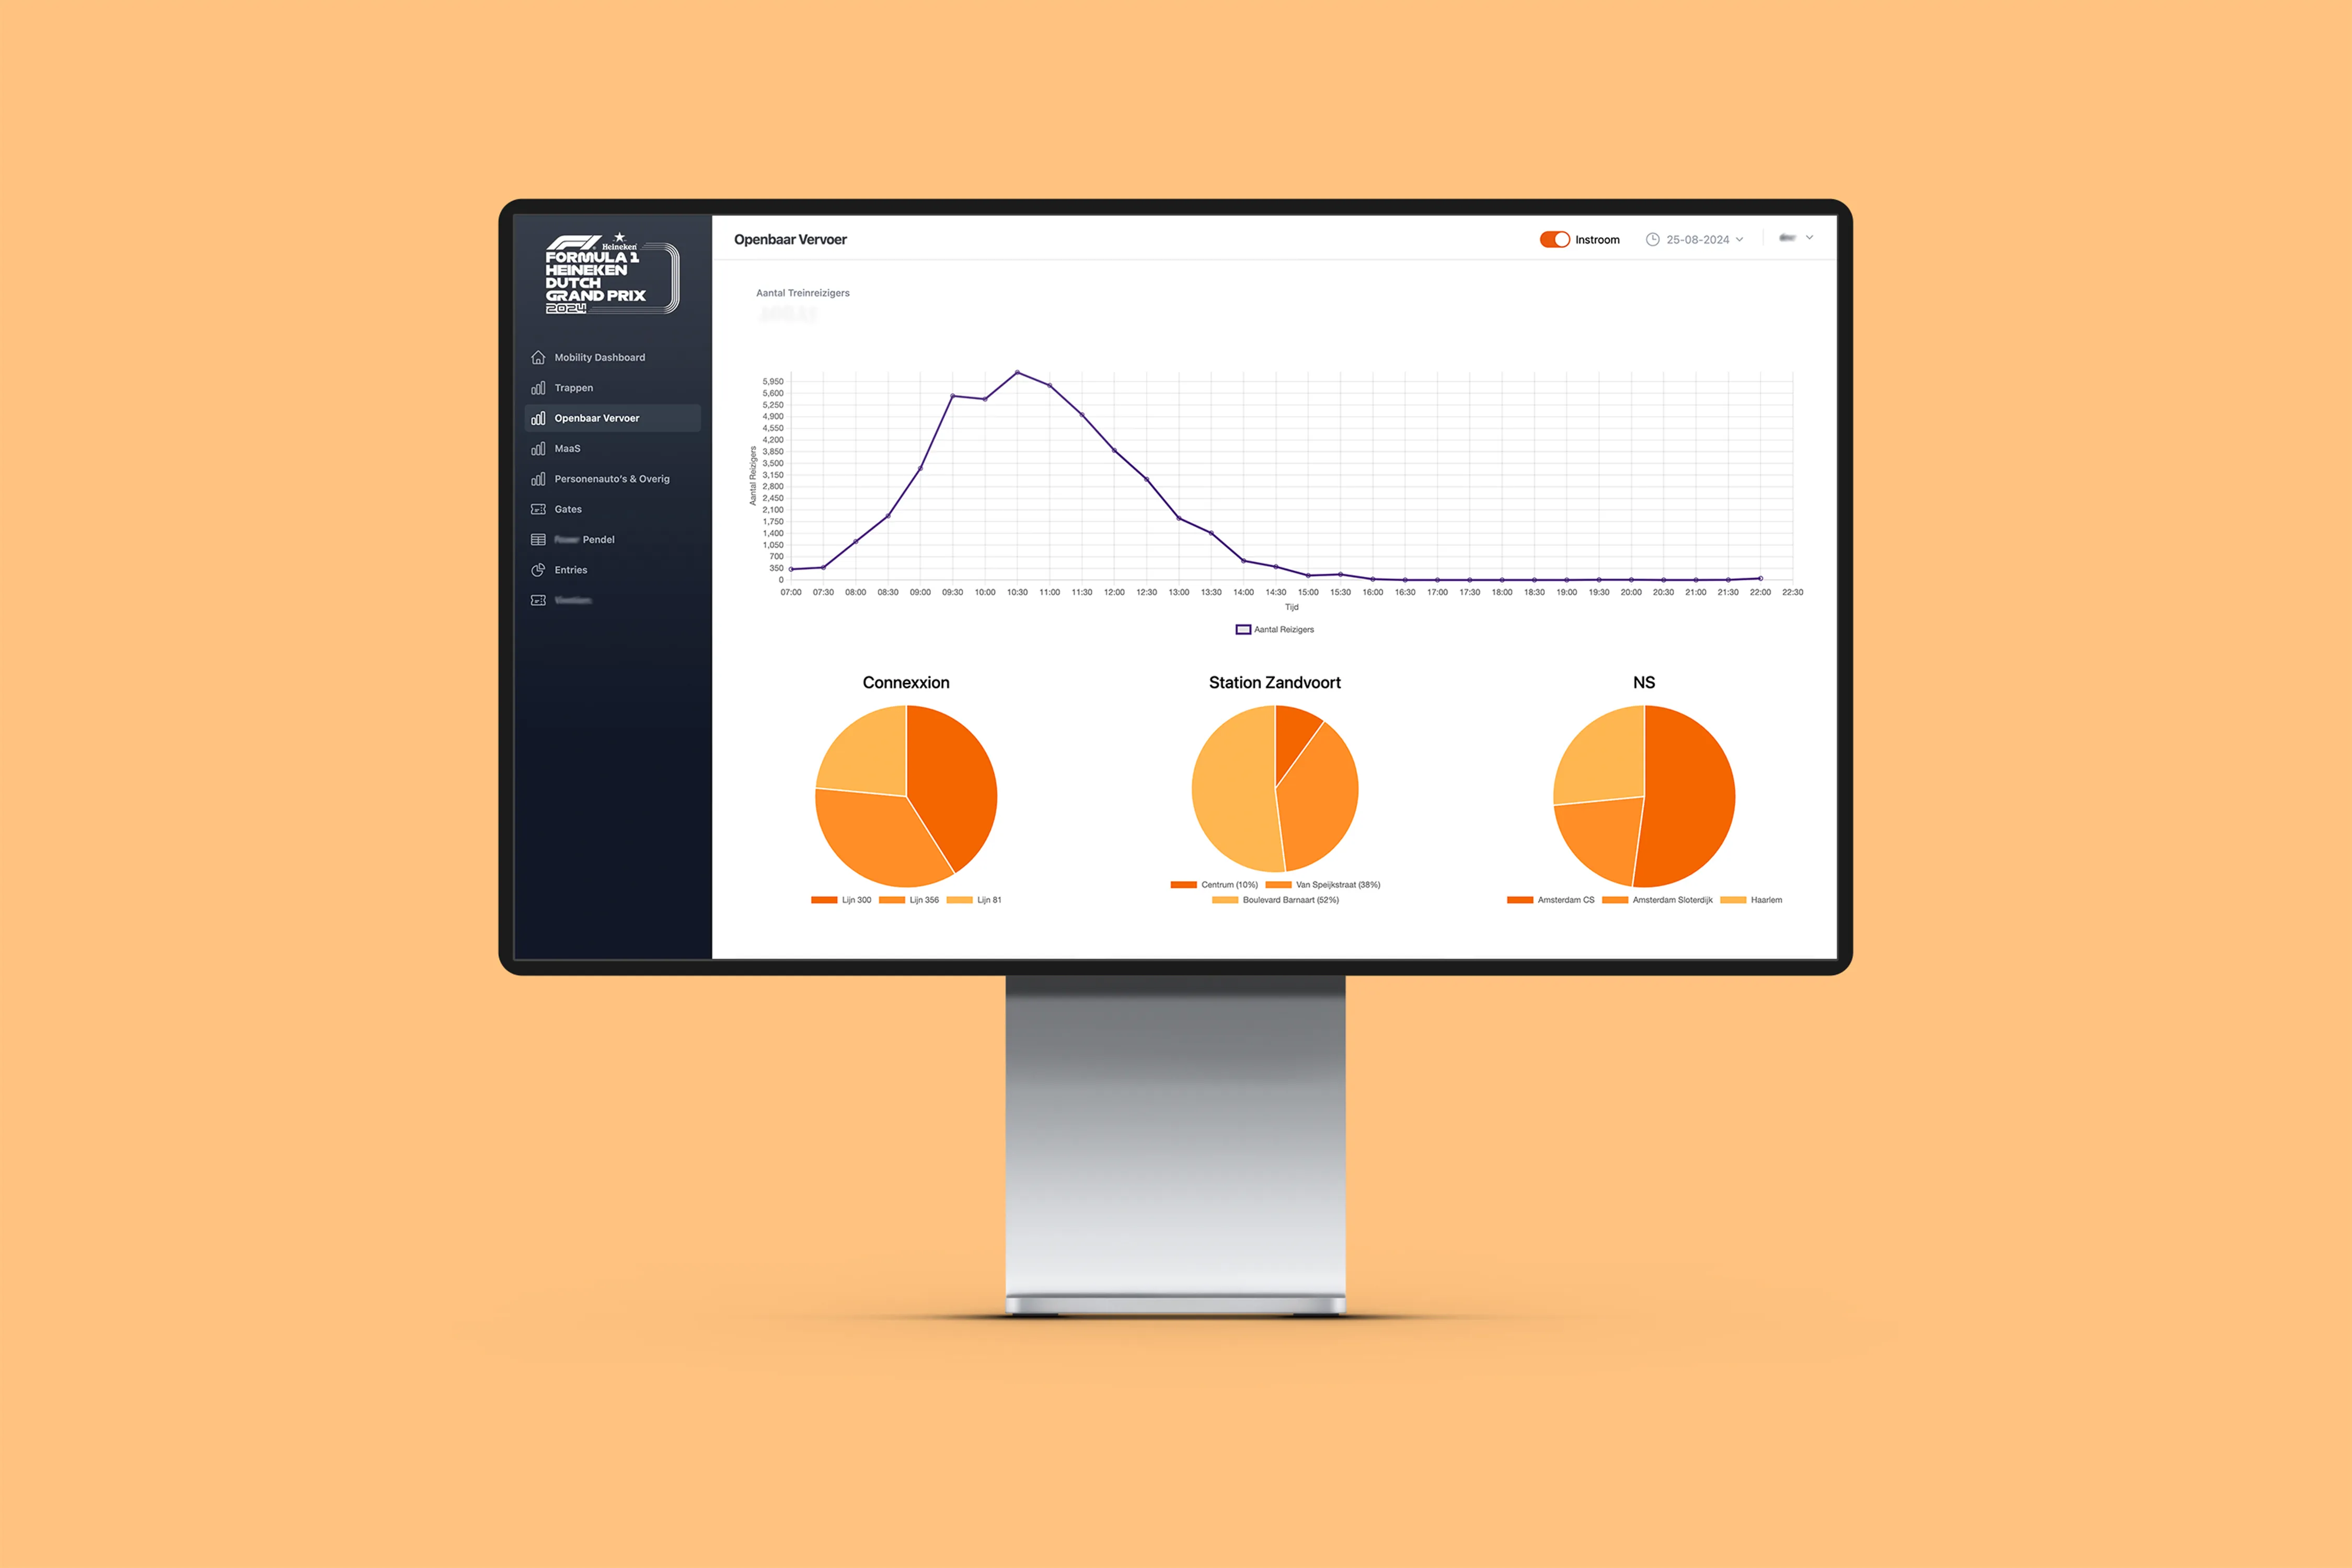
It standardizes and visualizes the data through intuitive dashboards, providing real-time insights into travel patterns and sustainability.
Gathering data
The cornerstone of the platform is data collection and processing. To accurately measure how people are traveling to the Zandvoort Circuit the mobility team had to make sure that all the possible means of transportation could be measured.
To achieve this a combination of camera sensors, APIs, and manual data gathering had to be implemented:
Sensors
Cameras with special sensors that allow artificial intelligence (AI) video analytics are placed at key areas where attendees walk to reach their end destination.
These sensors were placed by ViNotion and Connection Systems. They use Computer Vision to identify attendees and distinguish their direction.
This data is stored* on the sensor itself and is pushed to our database every minute.
APIs
APIs are mechanisms that enable two software applications to communicate with each other using a set of definitions and protocols.
Transportation providers that had developed APIs to control their operations granted us access to fetch real-time data.
Examples of data we received through APIs:
- Bicycle parking availability
- Amount of bus passengers currently going to the circuit.
All APIs used the design principle “representational state transfer” (REST).
Manual Data Collection
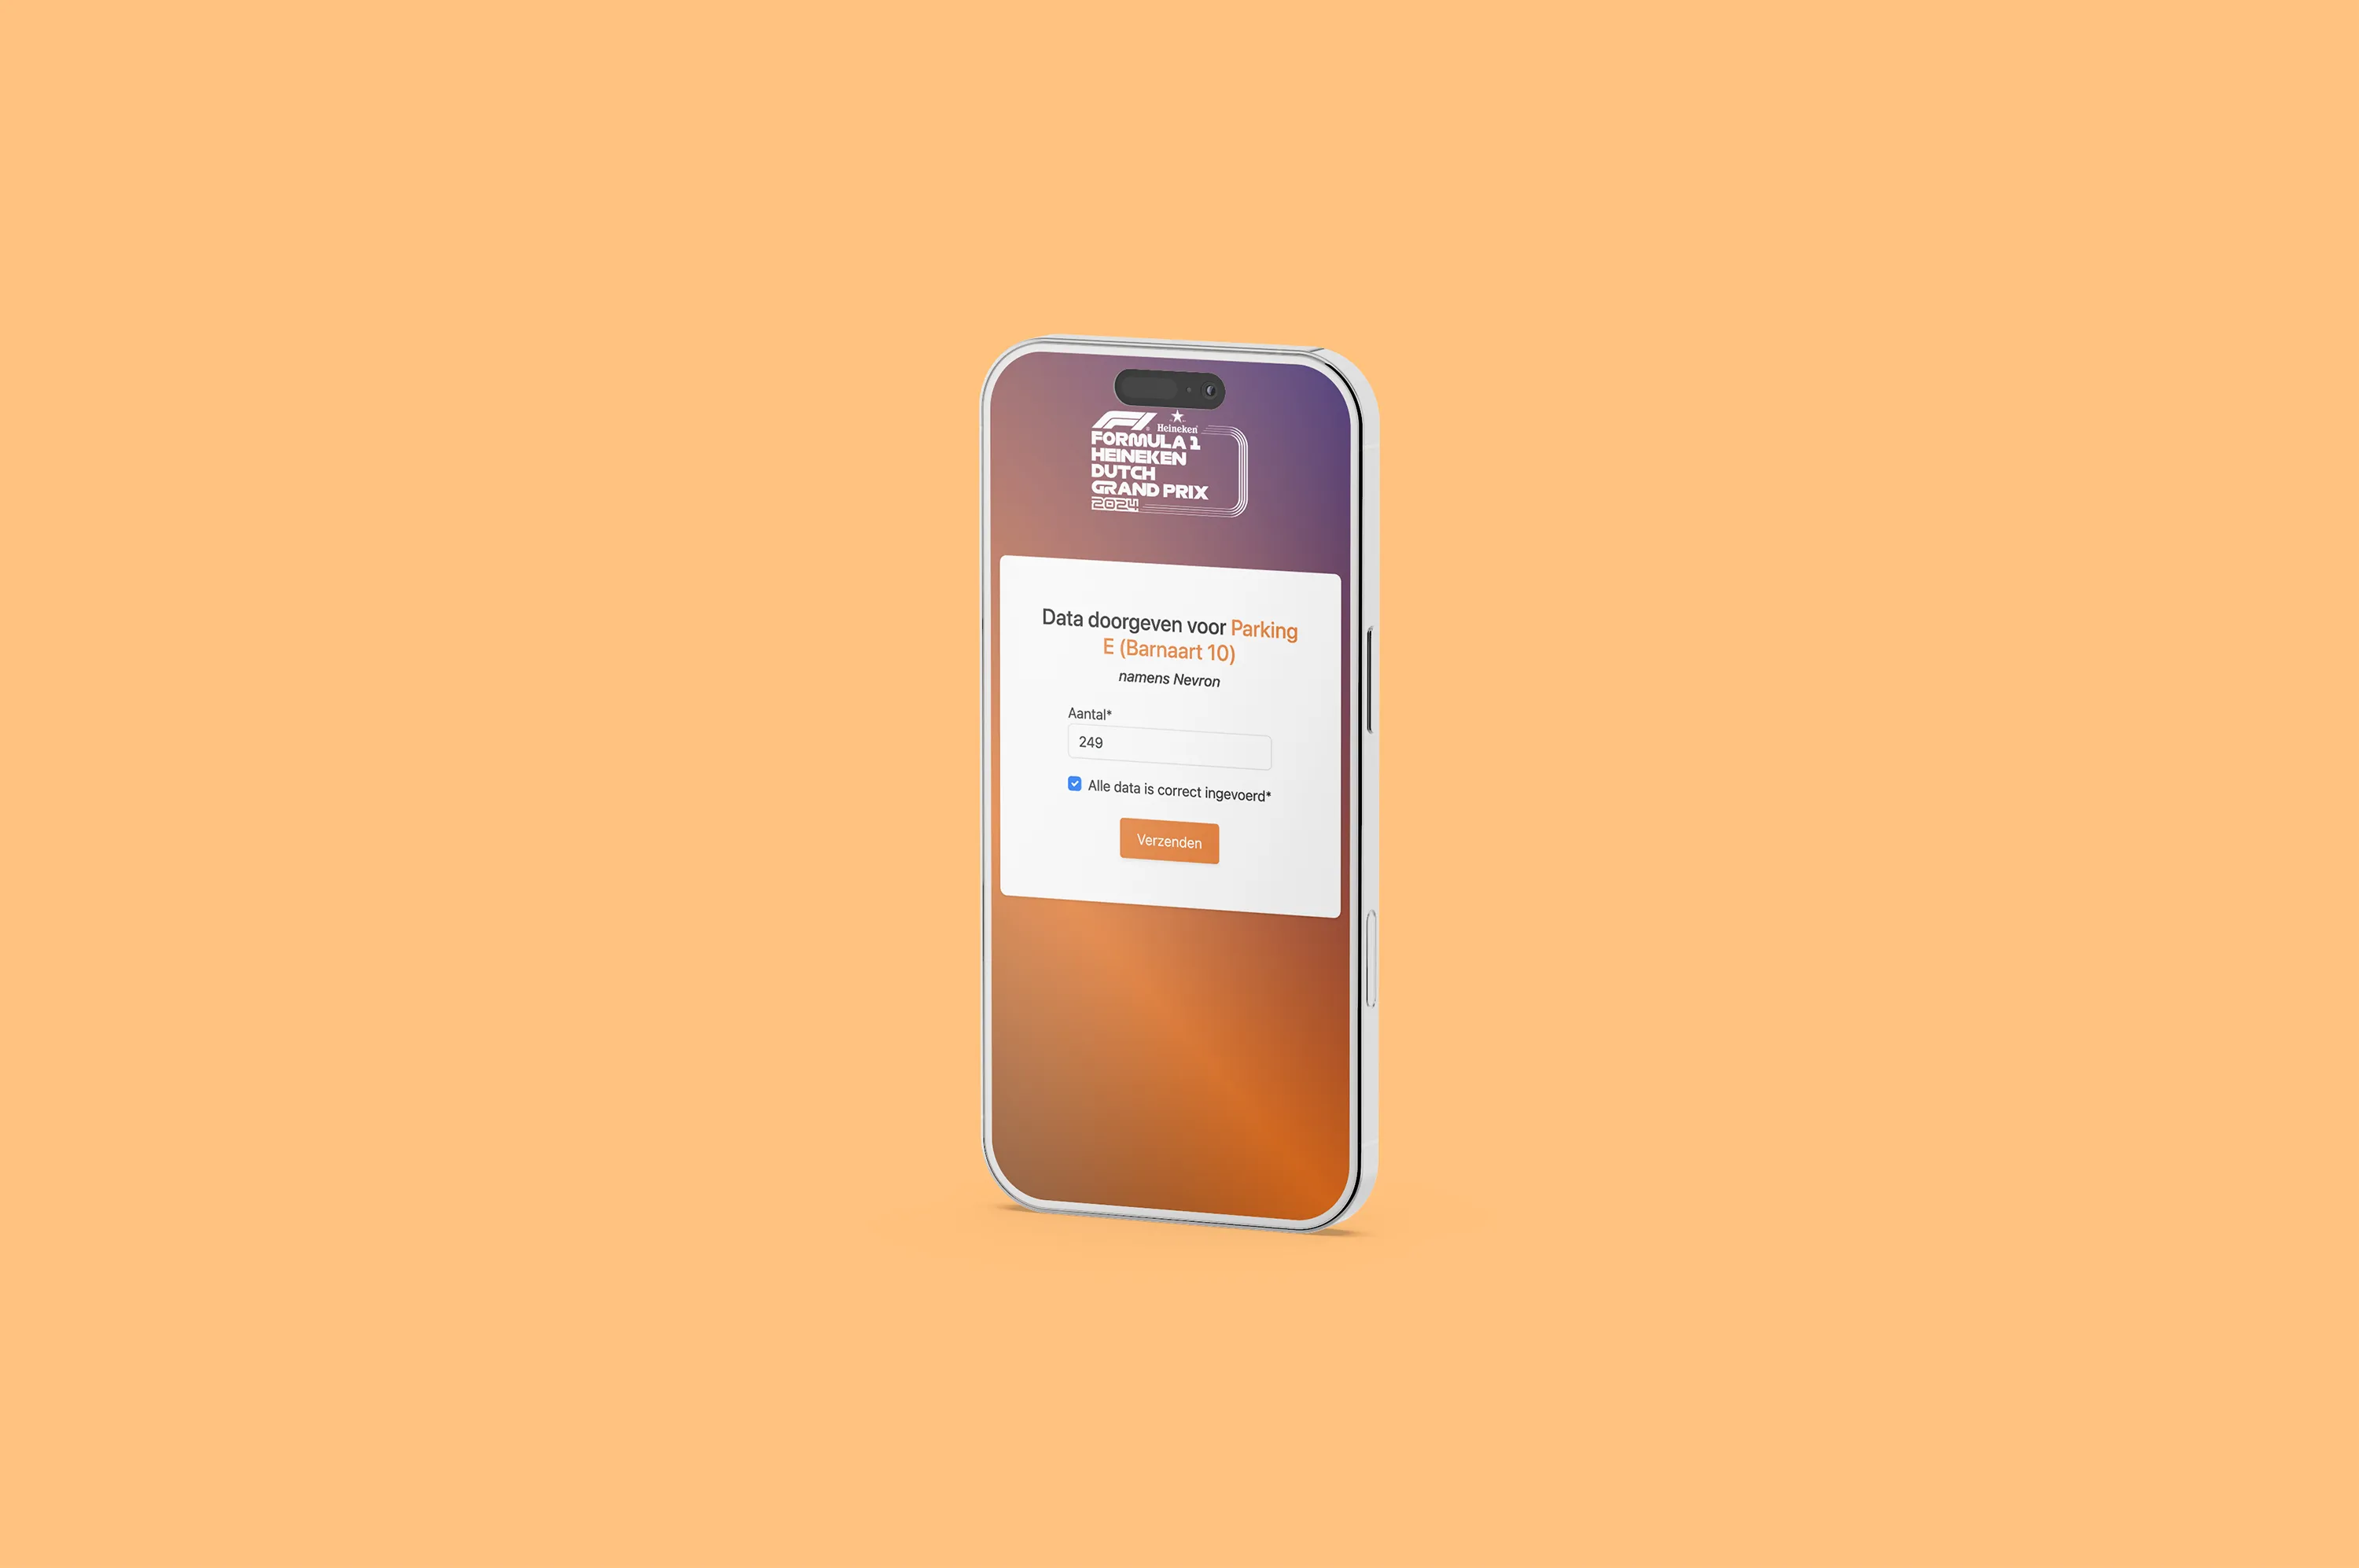
For data providers without APIs, we developed an SMS queuing system to gather information from key stakeholders through online forms.
Since some data providers lacked APIs, we implemented an SMS queuing system to collect data from key stakeholders via online forms. Once the form is filled in it pushes the data to the back-end.
Examples of data we received through timed online forms:
- Bicycle, motorbike, and touring car parking places without APIs
- Public transport companies without APIs
By using a queuing system, SMS and HTML forms we developed a way for key stakeholders to communicate data to our platform without the need of an API.
Translating and displaying data
Every data source has a different representation of their data. To visualize the data we first have to define a uniform data structure.
After consulting the client, inspecting the data, and analyzing visualization needs, we concluded that we need four “Data Points”:
Data stored:
- Data source = Where the data is coming from (ex. sensor 1, bicycle parking 10, etc.)
- Timestamp = When did we receive the data
- Flow = What direction are people following (inflow / outflow)
- Amount = The number of people
With this structure we are able to translate and process the data.
By using data visualization libraries we were able to create graphs that update automatically in the user interface.
Technical details
To make this project a reality we had to choose technologies that have 1) have existed for some time and are proven to be reliable and 2) are future proof.
Technologies used:
- The back-end was built with Django, a python framework.
- Celery, which is an open source asynchronous task queue or job queue, was used to automate the SMS flow.
- The API was built with Django REST Framework (DRF).
- For the front-end we used Nuxt.js, a Vue.js framework built on top of Javascript.
- Chart.js which is an open-source JavaScript library for data visualization was used to create the graphs.
The Results
Over the past years, we were able to provide the mobility team and key stakeholders with a platform where they can see in real-time how people are traveling to the Zandvoort Circuit and assist them with their decision making.
By tracking and translating the data we were able to help the organization measure their sustainability efforts and give actionable insights.
The platform's insights enabled more efficient transport planning and contributed to F1's sustainability goals.
- 0% Downtime
- 40000+ Data points
- 99% Sustainable travel
- 110k+ Attendees daily
*No personal data was collected or stored. All data processed can not be associated with individuals and is GDPR compliant.

Are you ready to grow with custom software development?